 |  |  |
| Figure 1 | Figure 2 | Poster Version |
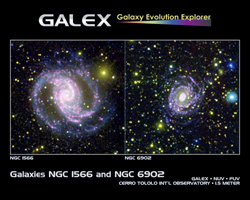
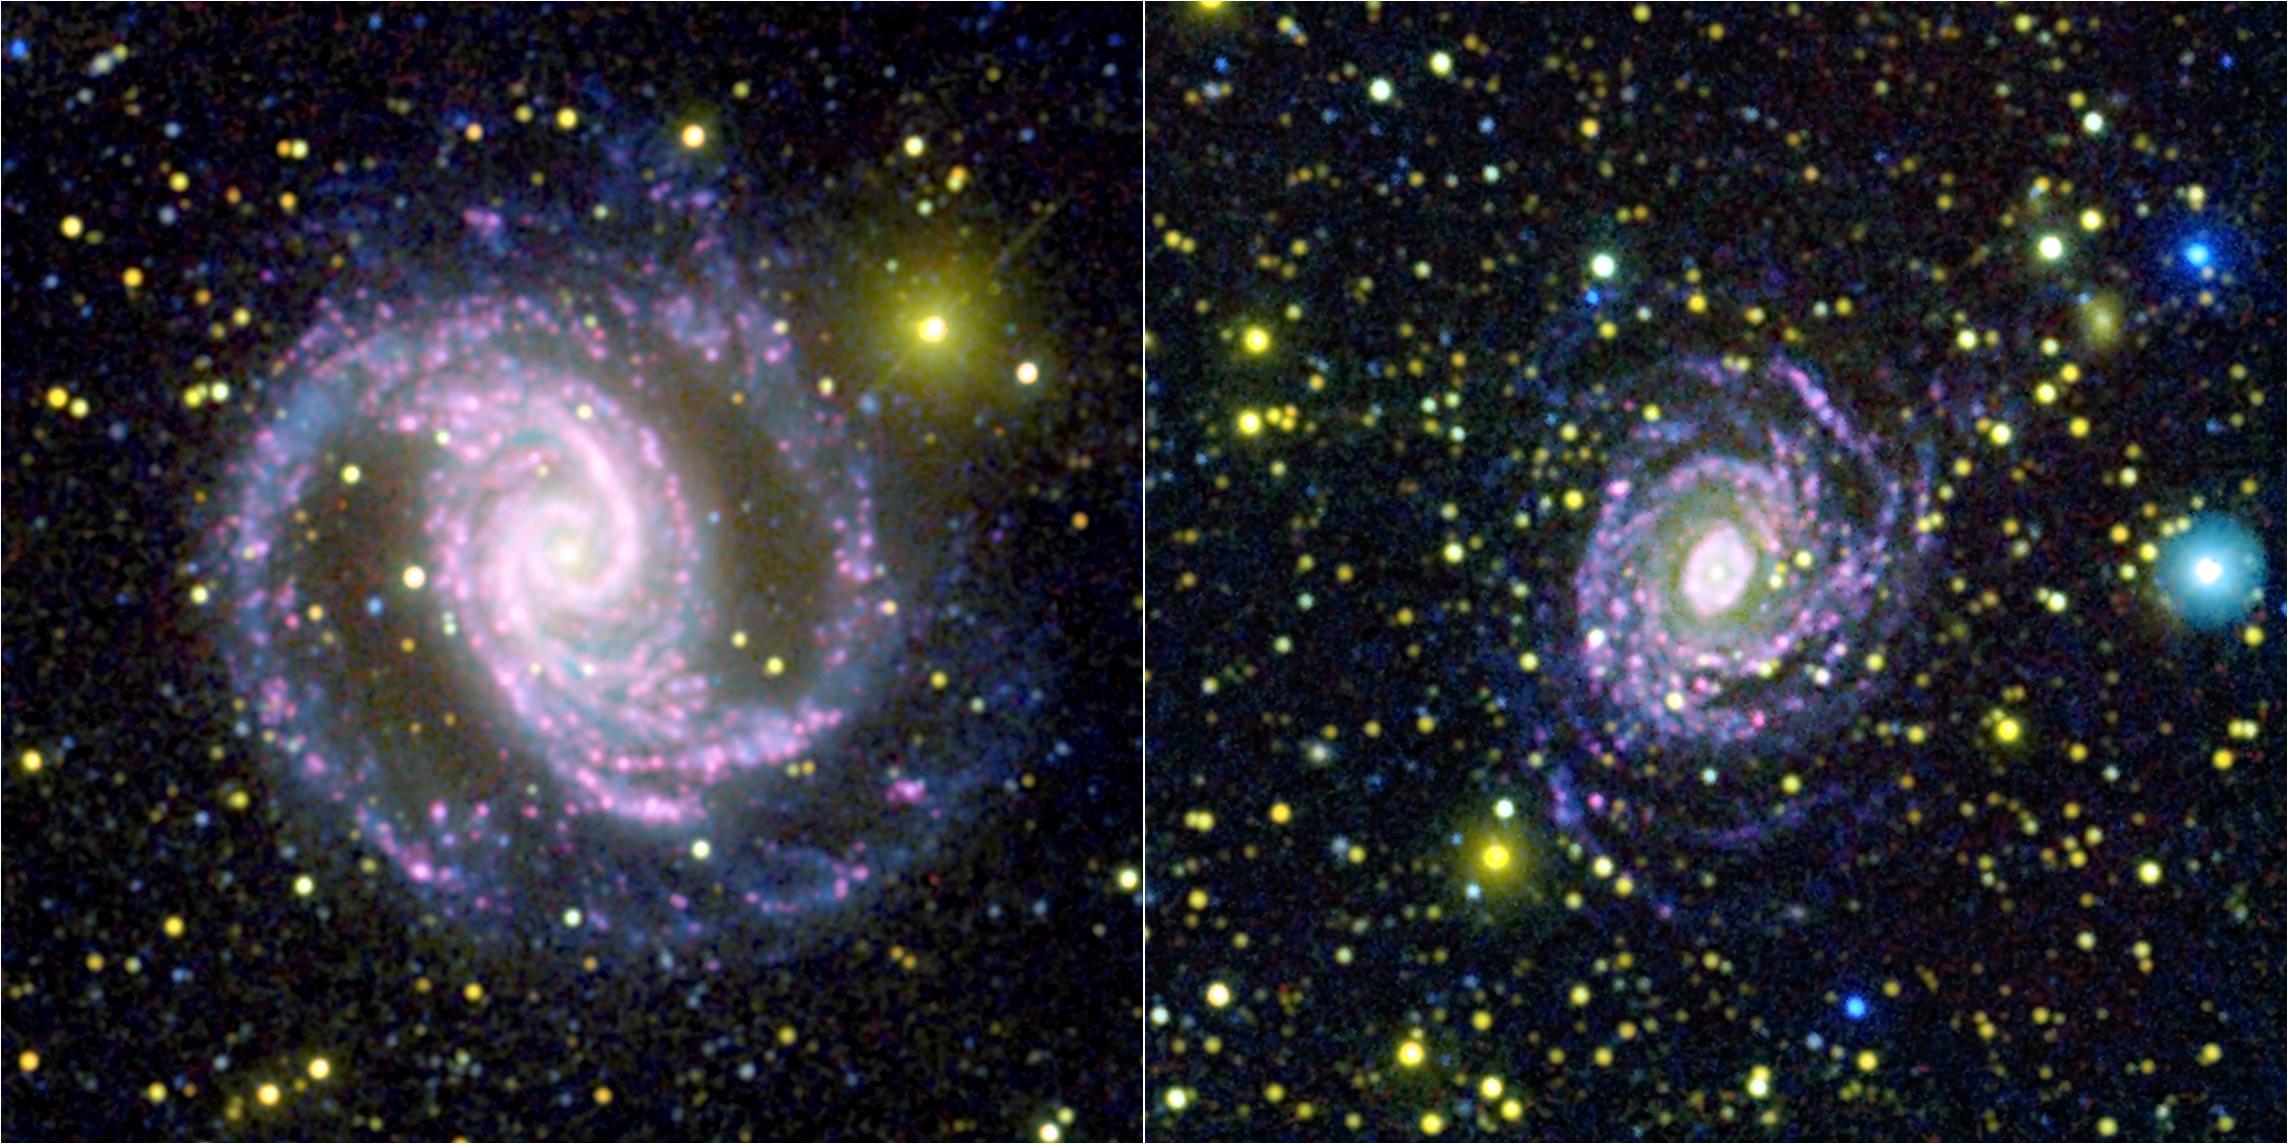
Click on an individual image for larger viewThese two photographs were made by combining data from NASA's Galaxy Evolution Explorer spacecraft and the Cerro Tololo Inter-American Observatory in Chile. By combining the data, astronomers were able to learn that not all galaxies make stars of different sizes in the same quantities, as was previously assumed. In other words, the proportion of small to big stars can differ from galaxy to galaxy.
Images taken with the Galaxy Evolution Explorer at shorter ultraviolet wavelengths are dark blue, while longer ultraviolet wavelengths are light blue. The optical images are colored red and yellow; red light is shown in yellow, while specially filtered red light from a type of hydrogen emission called H-alpha is colored red.
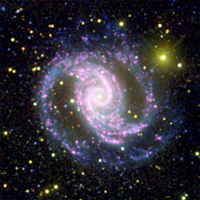
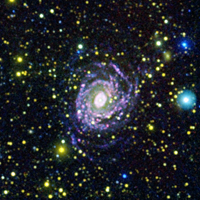
In these pictures, the portions of galaxies that are rich in massive stars, called "O" stars, show up as white or pink. Areas dominated by smaller stars, called "B" stars, appear blue.
The spiral galaxy on the left, called NGC 1566, is an example of a galaxy that is comparatively rich in O stars compared to B stars. By contrast, the galaxy on the right, NGC 6902, has a weaker population of O stars compared to its B stars.
NGC 1566 is 68 million light years away in the southern constellation of Sagittarius.
