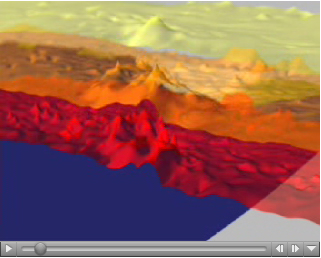
Click on image to view the movieThis animation depicts changes in the temperature of Hurricane Isabel as the storm moved across the Atlantic Ocean. The thermal structure is visualized as three surfaces of equal temperature, or isotherms. The temperature of each isotherm is represented by its color: red is warmest at 62 F (17 C), orange is the freezing level of 32 F, or 0 C, and yellow represents very cold temperatures of -10 F, or -23 C. The animation tracks the hurricane from September 6, 2003 when Isabel formed off the west coast of Africa, through September 18, 2003 when it made landfall on the east coast of the United States. AIRS made 15 observations of the hurricane during this period. The storm maintains a coherent shape throughout most of its life. This shape features a distinct 'hump' in all three isotherm, corresponding to cooling of air as it is uplifted in Isabel's thunderstorms. This hump undergoes a distinct spreading as the storm moves westward, being much wider on the 17th than on the 14th. The storm winds were significantly more powerful on the 14th, but the winds were apparently concentrated over a relatively smaller area. Also seen on the final day is the beginning of the end of the storm. The hump in the -10 F isotherm has disappeared in the last image, suggesting that Isabel's thunderstorms have begun to weaken as the hurricane dissipates over land.
About AIRS
The Atmospheric Infrared Sounder, AIRS, in conjunction with the Advanced Microwave Sounding Unit, AMSU, senses emitted infrared and microwave radiation from Earth to provide a three-dimensional look at Earth's weather and climate. Working in tandem, the two instruments make simultaneous observations all the way down to Earth's surface, even in the presence of heavy clouds. With more than 2,000 channels sensing different regions of the atmosphere, the system creates a global, three-dimensional map of atmospheric temperature and humidity, cloud amounts and heights, greenhouse gas concentrations, and many other atmospheric phenomena. Launched into Earth orbit in 2002, the AIRS and AMSU instruments fly onboard NASA's Aqua spacecraft and are managed by NASA's Jet Propulsion Laboratory in Pasadena, Calif., under contract to NASA. JPL is a division of the California Institute of Technology in Pasadena.
More information about AIRS can be found at http://airs.jpl.nasa.gov.