 |  |
| Click on the image for Poster Version | Click on the image for QuickTime movie |
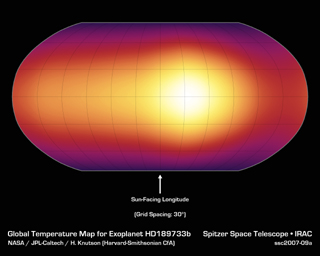
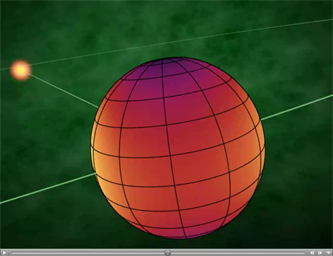
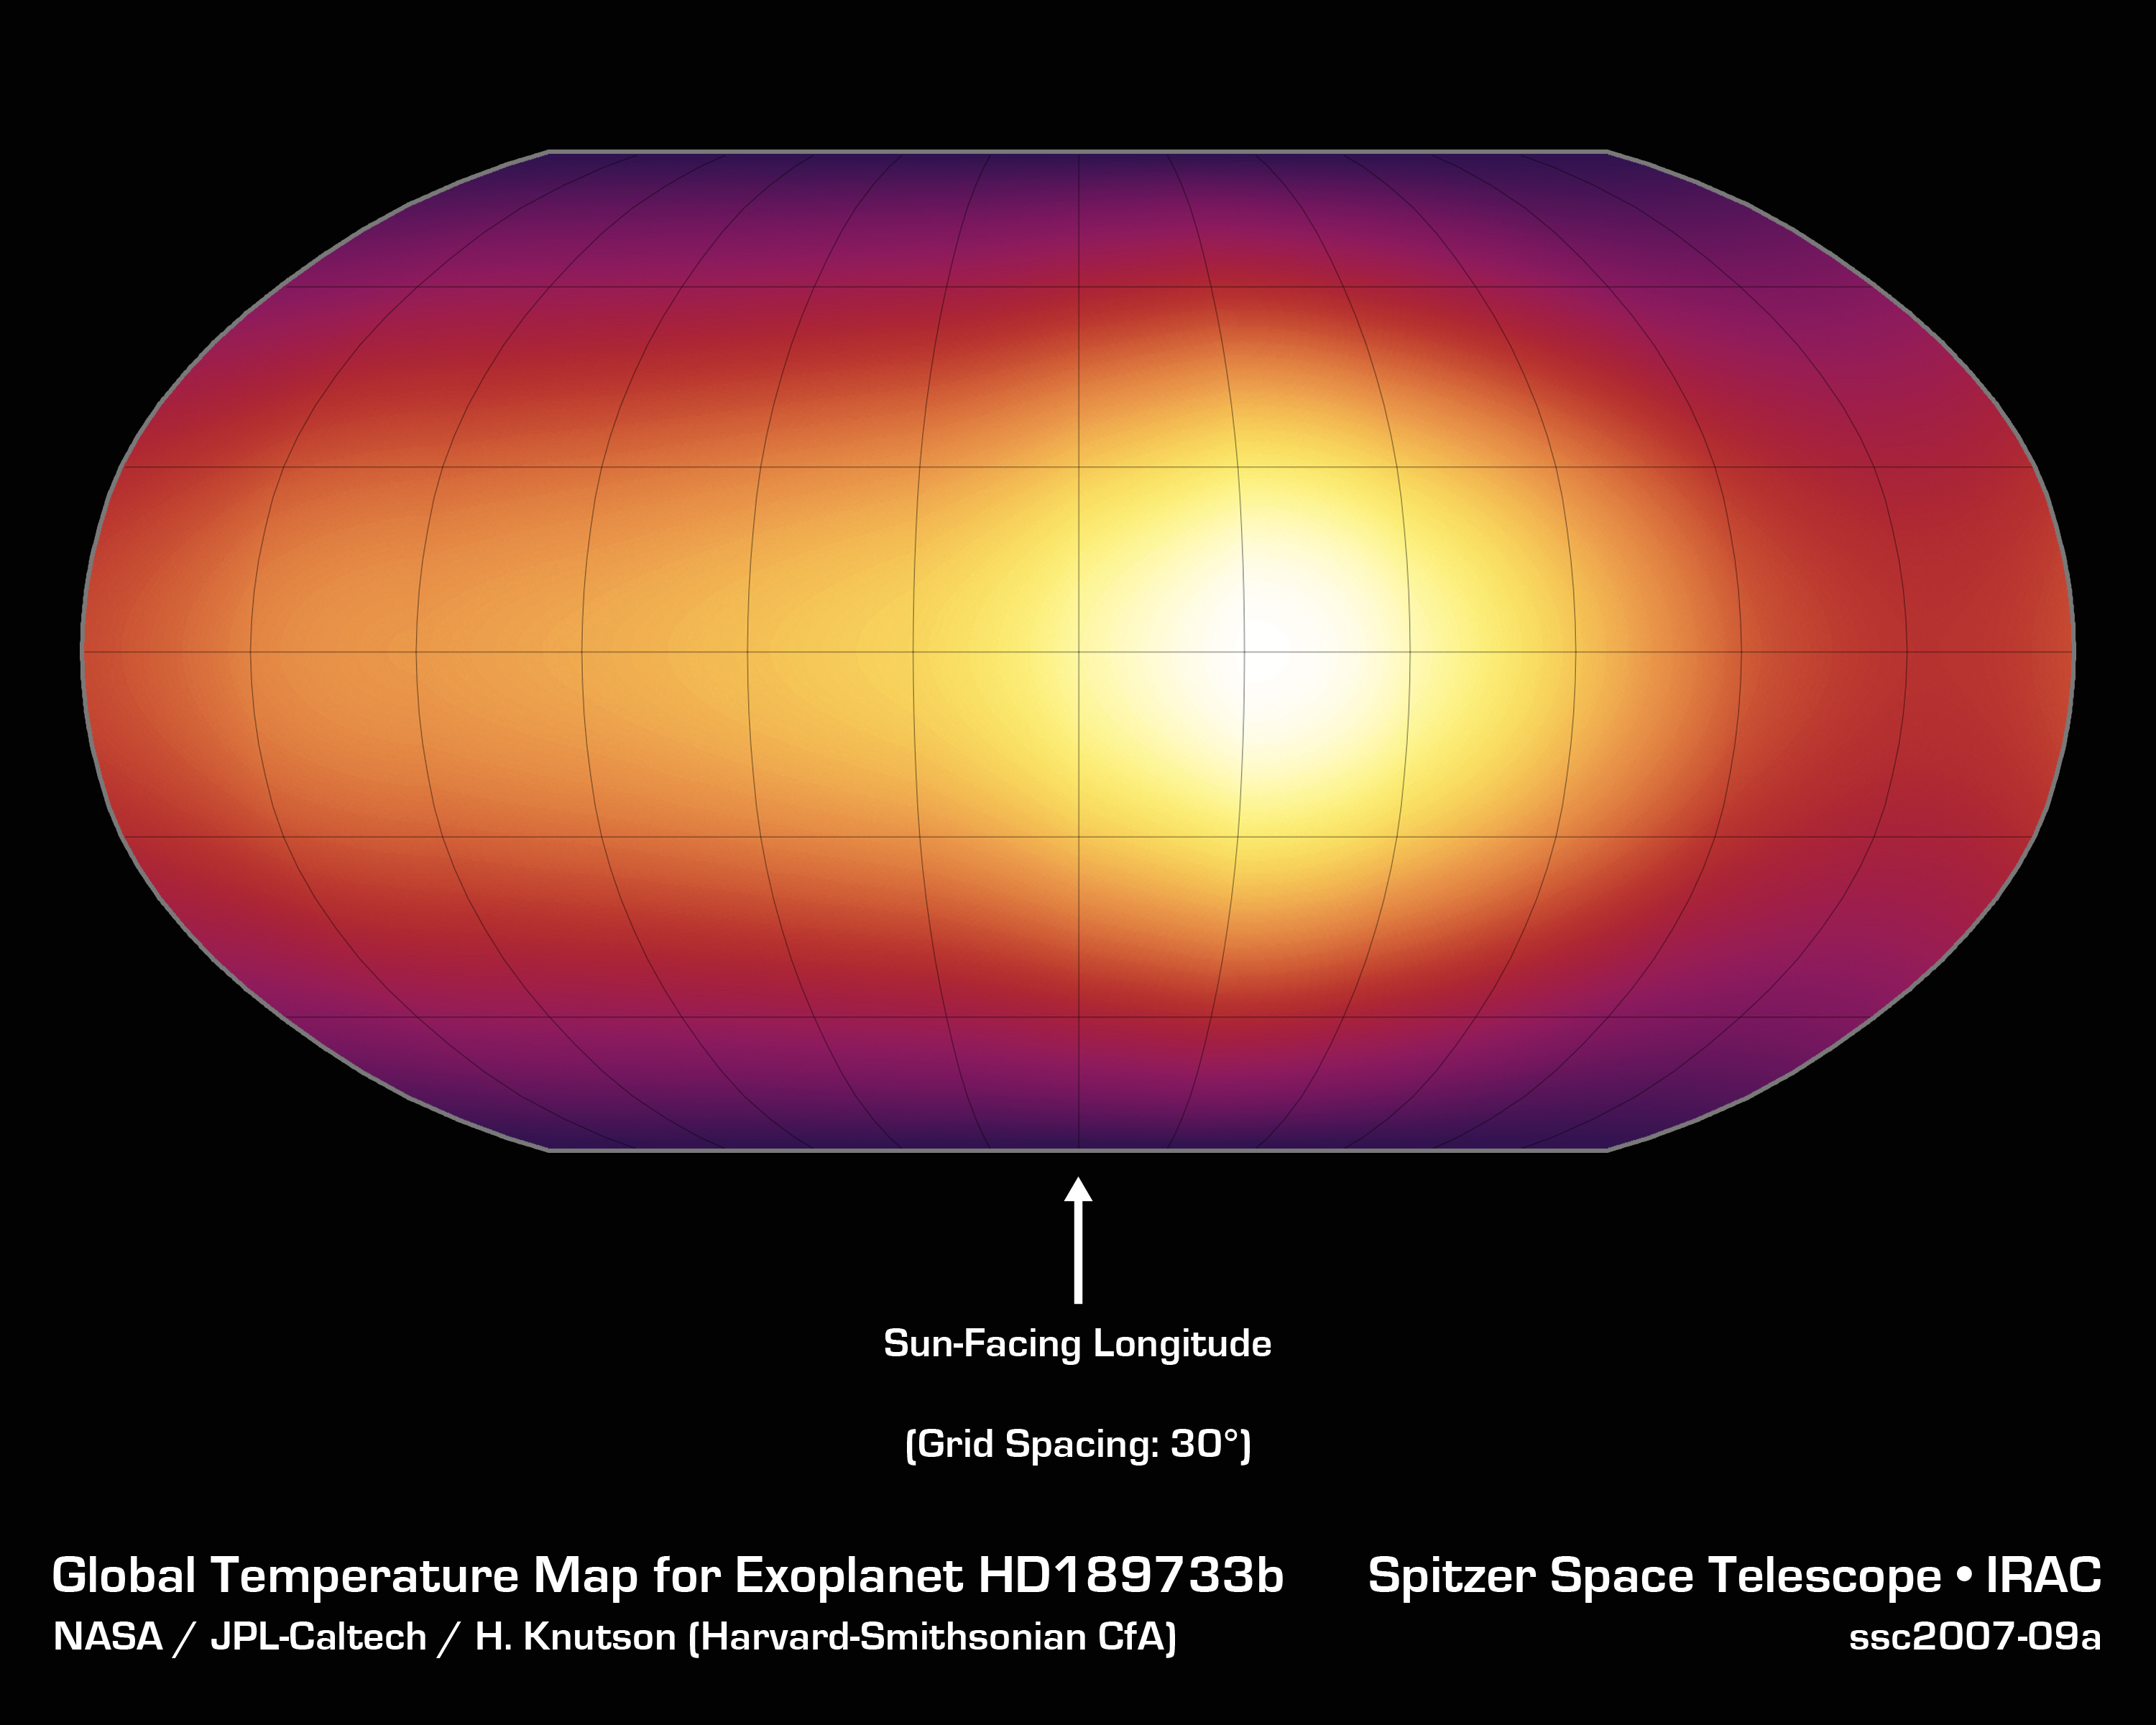
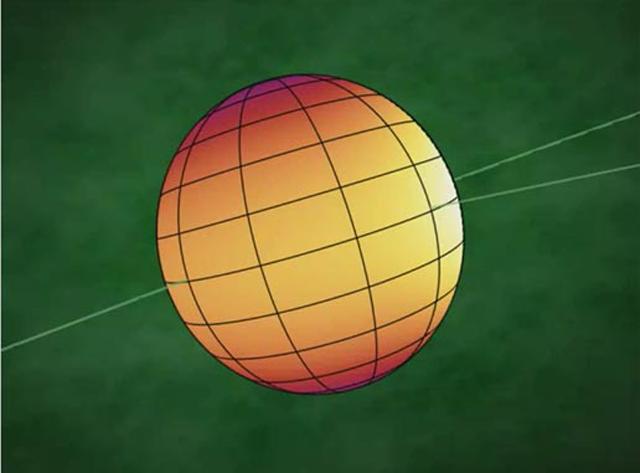
This animation shows the first-ever map of the surface of an exoplanet, or a planet beyond our solar system. The map, which shows temperature variations across the cloudy tops of a gas giant called HD 189733b, is made up of infrared data taken by NASA's Spitzer Space Telescope. Hotter temperatures are represented in brighter colors.
HD 189733b is what is known as a hot-Jupiter planet. These sizzling, gas planets practically hug their stars, orbiting at distances that are much closer than Mercury is to our sun. They whip around their stars quickly; for example, HD 189733b completes one orbit in just 2.2 days. Hot Jupiters are also thought to be tidally locked to their stars, just as our moon is to Earth. This means that one side of a hot Jupiter always faces its star.
As predicted, the map reveals that HD 189733b has a warm spot on its "sunlit" side, which is always pointed toward the star. But the map also shows that this spot is offset from the high-noon, or sun-facing, point by 30 degrees. According to scientists, ferocious winds traveling up to 6,000 miles per hour (nearly 9,700 kilometers per hour) are probably pushing the hot spot to the east.
In addition to the warm spot, the map tells astronomers that temperatures on HD 189733b are fairly even all around. While the dark side is about 1,200 degrees Fahrenheit (650 degrees Celsius), the sunlit side is just a bit hotter at 1,700 degrees Fahrenheit (930 degrees Celsius). This mild temperature variation is more evidence for strong winds, since winds would help spread the heat from the hot, sunlit side over to the dark side.
These data were collected by Spitzer's infrared array camera as the planet, a so-called transiting planet, passed in front of its star, then swung around and disappeared behind it (see PIA09377). By observing the planet for half of its 2.2-day long orbit, Spitzer was able to measure the infrared light, or heat, coming from its entire surface. The infrared measurements, about a quarter of a million individual data points, were then assembled by scientists into pole-to-pole strips, and ultimately into the complete map shown here.