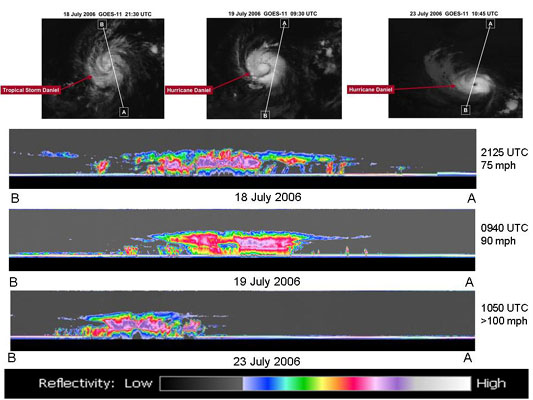
Figure 1Hurricane Daniel intensified between July 18 and July 23rd. NASA's new CloudSat satellite was able to capture and confirm this transformation in its side-view images of Hurricane Daniel as seen in this series of images.
The top images in figure 1 are from the National Oceanic and Atmospheric Administration's Geostationary Operational Environmental Satellite (GOES) to give an idea of how the storm looked from the top. The bottom images are from CloudSat.
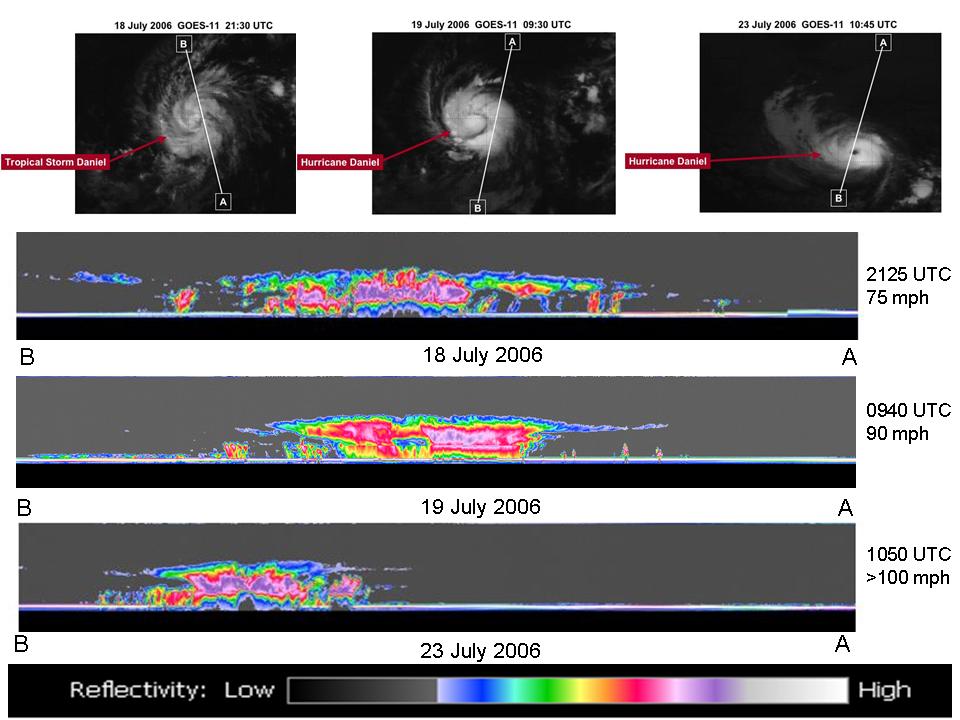
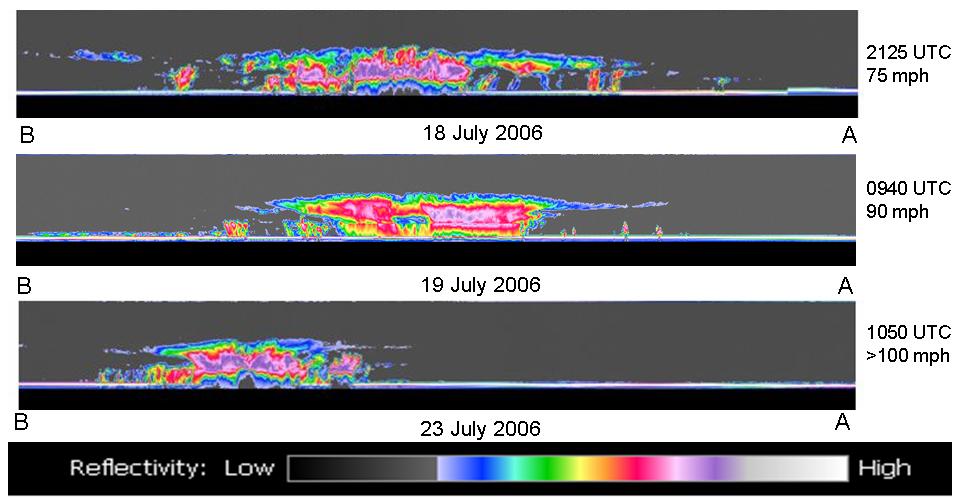
The first CloudSat image was taken from NASA's CloudSat satellite on July 18 at approximately 5:25 p.m. EDT (21:25 UTC). The second image was taken July 19th at approximately 5:40am EDT (0940 UTC). The third image was taken on July 23rd around 650am EDT (1050 UTC).
The red and purple areas indicate large amounts of cloud water. The blue areas along the top of the clouds indicates cloud ice, while the wavy blue lines on the bottom center of the image from 18 July and 23 July indicate intense rainfall. Notice that the solid line along the bottom of the panels from 18 July and 23 July, which is the ground, disappears in these areas of intense precipitation. It is likely that in the area the precipitation rate exceeds 30mm/hr (1.18 inches/hour) based on previous studies.
From one side of the storm to the other, on July 18, Daniel appeared to be approximately 700 km. The scale from top to bottom is approximately 30 km, so the clouds in this hurricane reach heights of about 20 km. On July 19, Daniel appears to intensify and became more compact as its maximum sustained winds increased from 75 to 90 mph. By 23 July, the winds had intensified to greater than 100 mph.
The CloudSat images shown here will provide analysts and forecasters a view of hurricanes and typhoons that has not been available before. The cross-sections shown in the bottom panels provide a view of the internal dynamics of these storms that gives us important information about the intensity, rainfall rates, and internal temperature fields of these storms, all of which will help forecasters better predict how the storms will intensify or weaken, and what the potential impact might be from rainfall and wind.
Quicklook Images can viewed at the CloudSat Data Processing Center.
