- Original Caption Released with Image:
-

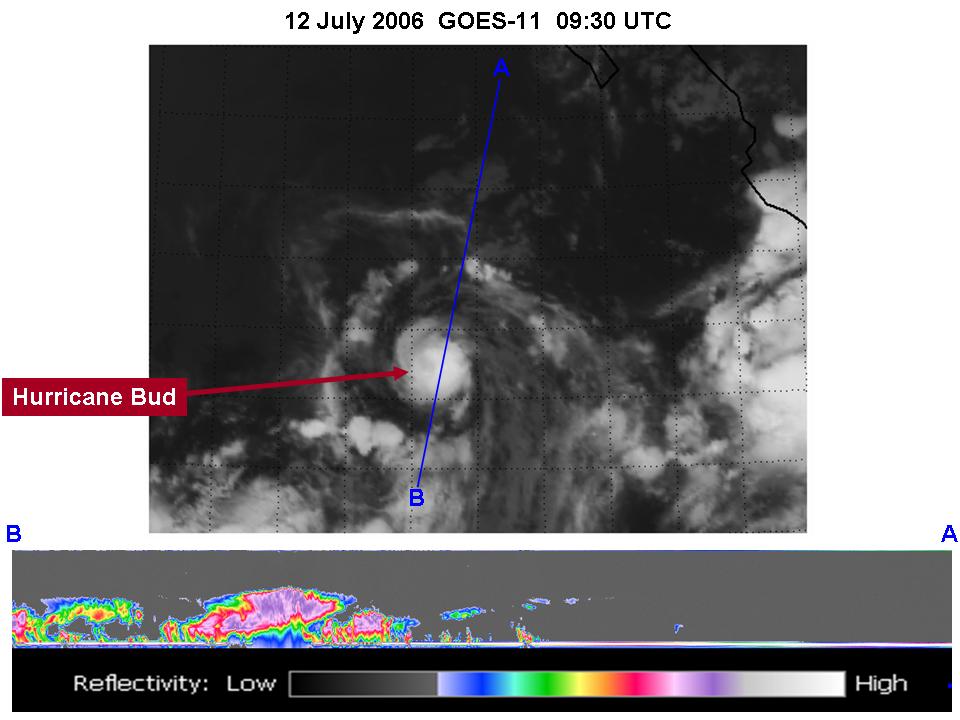
Figure 1The image at the top of figure 1 is from a geostationary imager. The colors relate to the temperature of the clouds. The higher the clouds, the lower the temperature. The highest, coldest clouds are located near the center of the hurricane. The line from A to B represents the orbit track of CloudSat across the hurricane on 12 July. Notice that CloudSat very nearly flew over the center of the hurricane, but at this early stage of the storm the eye is very small and not well developed. Unlike the imager used by the geostationary satellite, CloudSat has a only single footprint view directly below and along the track of the orbit. However, CloudSat can see the vertical dimension of the clouds that the geostationary imager is unable to see, ie CloudSat "sees inside" the clouds directly under the orbit track. This is displayed in the bottom panel of figure 1. CloudSat sends pulses of microwave energy through the clouds, and some of the energy in the pulses is reflected back to the spacecraft. The time delay between when the pulse is sent and when the reflected energy is received back at the spacecraft is mapped into a distance of the cloud from the surface of the Earth, and the strength of the energy received is related to how much water or ice is contained in the cloud. The colors in the bottom panel are an indication of the strength of the returned signal, termed the reflectivity. The red and purple areas indicate large amounts of cloud water or precipitation. Slightly to the left of center of the bottom panel, there is an indication of intense precipitation. We know this because the radar signal is attenuated near the ground (notice that the solid line along the bottom of the panel, which is the ground, disappears in this area of intense precipitation). It is likely that in the area the precipitation rate exceeds 30mm/hr based on previous studies. The scale from left to right is approximately 1300 km, and the vertical scale from top to bottom is approximately 30km.The CloudSat data indicate that the cloud heights may be near 20km.
- Image Credit:
-
NASA/JPL/The Cooperative Institute for Research in the Atmosphere (CIRA),
Colorado State University
Image Addition Date: -
2006-07-13
|
