PDS logoPlanetary Data System
PDS Information
Find a Node - Use these links to navigate to any of the 8 publicly accessible PDS Nodes.

This bar indicates that you are within the PDS enterprise which includes 6 science discipline nodes and 2 support nodes which are overseen by the Project Management Office at NASA's Goddard Space Flight Center (GSFC). Each node is led by an expert in the subject discipline, supported by an advisory group of other practitioners of that discipline, and subject to selection and approval under a regular NASA Research Announcement.
Click here to return to the Photojournal Home Page Click here to view a list of Photojournal Image Galleries Photojournal_inner_header
Latest Images  |  Spacecraft & Technology  |  Animations  |  Space Images App  |  Feedback  |  Photojournal Search  

PIA07219: NASA/French Satellite Data Reveal New Details of Tsunami
 Target Name:  Earth
 Is a satellite of:  Sol (our sun)
 Mission:  Jason-1 
 Spacecraft:  Jason Satellite
 Instrument:  Altimeter 
 Product Size:  1590 x 1800 pixels (w x h)
 Produced By:  JPL
 Full-Res TIFF:  PIA07219.tif (1.269 MB)
 Full-Res JPEG:  PIA07219.jpg (280 kB)

Click on the image above to download a moderately sized image in JPEG format (possibly reduced in size from original)

Original Caption Released with Image:

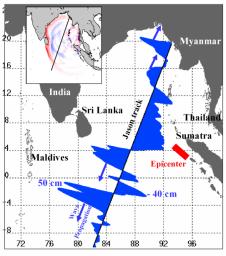
Displayed in blue color is the height of sea surface (shown in blue) measured by the Jason satellite two hours after the initial magnitude 9 earthquake hit the region (shown in red) southwest of Sumatra on December 26, 2004. The data were taken by a radar altimeter onboard the satellite along a track traversing the Indian Ocean when the tsunami waves had just filled the entire Bay of Bengal (see the model simulation inset image). The data shown are the changes of sea surface height from previous observations made along the same track 20-30 days before the earthquake, reflecting the signals of the tsunami waves.

The maximum height of the leading wave crest was about 50 cm (or 1.6 ft), followed by a trough of sea surface depression of 40 cm. The directions of wave propagation along the satellite track are shown by the blue arrows.

Model Simulation:
Simulated changes of sea surface height caused by the earthquake two hours after the initial shock. The simulation was performed using a computer model and provided for public access via internet by Kenji Satake, National Institute of Advanced Industrial Science and Technology, Japan (http://www.ioc.unesco.org/itsu/templates/itsu/images/animation.gif). Wave crests are shown in red and troughs in blue. The track traversed by the Jason satellite was also shown. The simulated crests and troughs along the track are in agreement with the satellite observations. The map provides a basin-wide perspective for interpreting the satellite observations along a single track.

Image Credit:
NASA/JPL/CNES/National Institute of Advanced Industrial Science and Technology, Japan

Image Addition Date:
2005-01-12