A magnitude 6.5 earthquake devastated the small city of Bam in southeast Iran on December 26, 2003 at 5:26 AM local time.
While there have been several recent earthquakes on faults in the region, the city of Bam had not been affected by earthquakes for at least 500 years. Initial field studies found some minor evidence of fault motion, but the main fault rupture that caused the earthquake was discovered by analysis of data from the recently launched Envisat synthetic aperture radar system. Scientists from NASA's JPL and the Centre for Observation and Modelling of Earthquakes and Tectonics (University of Oxford, UK and the University of Cambridge, UK) used interferometry analysis of the Envisat radar data and seismology to study the fault rupture, that passed directly beneath the center of the city of Bam. The interferometry analysis was performed with software developed at JPL. A less used type of radar interferometry analysis called the interferometric correlation (shown in this figure) was used to locate the surface trace of the fault rupture. Scientists from the Geological Survey of Iran mapped the surface ruptures in the field at the locations discovered on these correlation images.
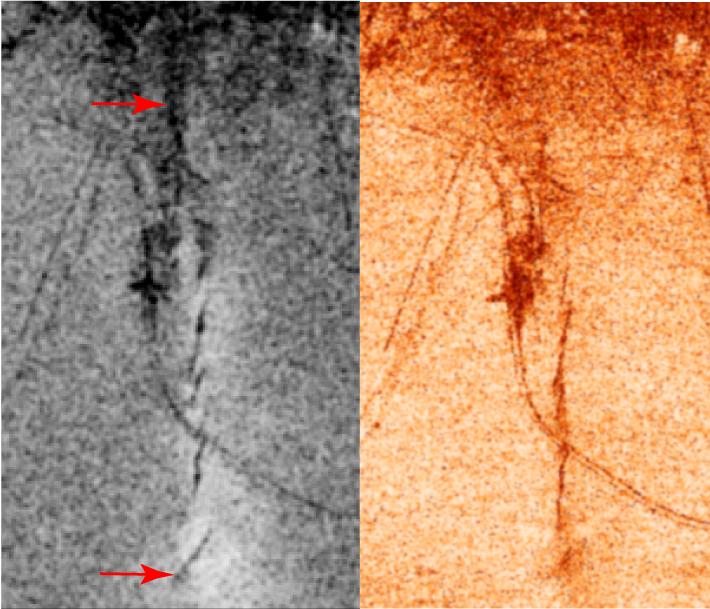
The two images show similar measures of the radar interferometric correlation in grayscale on the left and in false colors on the right. The city of Bam is at the top edge of the images, which are each 5 km (3 miles) wide. In the left image, the irregular black line between the two red arrows shows the fault rupture, where the interferometric correlation is very low. The "S" shaped dark line running across the image from top left to lower right is a railroad, and some other straight lines are roads that also have low correlation. The right image shows the correlation in colors with the darkest red-orange color indicating low correlation on the fault ruptures and other features.
For more information, see the following paper, published recently in Geophysical Research Letters:
Talebian, M., Fielding, E.J., Funning, G.J., et al. (2004), The 2003 Bam (Iran) earthquake: Rupture of a blind strike-slip fault, L11611, doi:10.1029/2004GL020058.
The full paper is available (subscription required) can be found at http://www.agu.org/pubs/crossref/2004/2004GL020058.shtml
and for United States Government research a reprint is available at http://trs-new.jpl.nasa.gov/dspace/handle/2014/6130.
Radar data used in this research were acquired by the Envisat satellite operated by the European Space Agency, which kindly made this data available for research. Part of this research was performed at the Jet Propulsion Laboratory, California Institute of Technology under contract with NASA. Part of this research was performed at the Centre for the Observation and Modelling of Earthquakes and Tectonics supported by the U.K. Natural Environment Research Council. Research was also performed by the Geological Survey of Iran.
Size: Images are 5 km (3 miles) wide
Location: 29.1 degrees North latitude, 58.3 degrees East longitude
Orientation: North is up (UTM projection)
Image Data: Envisat ASAR interferometric correlation
Image resolution: 20 meters (60 feet)
Dates Acquired: December 3, 2003 and January 7, 2004
