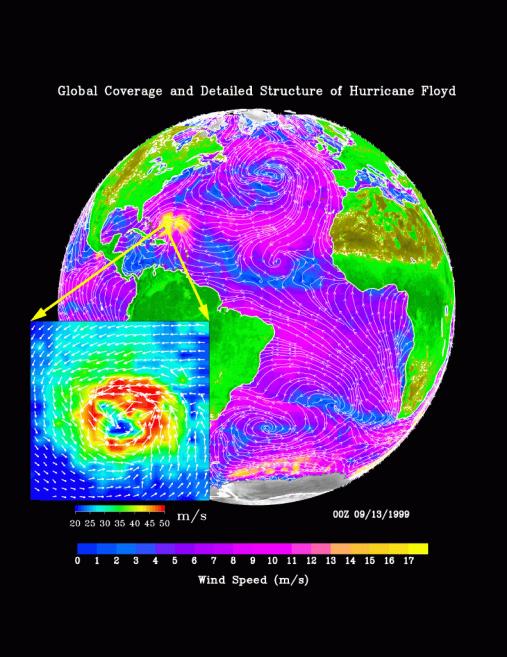
The distribution of ocean surface winds over the Atlantic Ocean, based on September 1999 data from NASA's SeaWinds instrument on the QuikScat satellite, shows wind direction (white streamlines) at a resolution of 25 kilometers (15.5 miles), superimposed on the color image indicating wind speed.
Over the ocean, the strong (seen in violet) trade winds blow steadily from the cooler subtropical oceans to warm waters just north of the equator. The air rises over these warm waters and sinks in the subtropics at the horse latitudes. Low wind speeds are indicated in blue. In the mid-latitudes, the high vorticity caused by the rotation of the Earth generates the spirals of weather systems. The North Atlantic is dominated by a high-pressure system, whose anti-cyclonic (clockwise) flow creates strong winds blowing parallel to the coast of Spain and Morocco. This creates strong ocean upwelling and cold temperature. Hurricane Floyd, with its high winds (yellow), is clearly visible west of the Bahamas. Tropical depression Gert is seen as it was forming in the tropical mid-Atlantic (as an anti-clockwise spiral); it later developed into a full-blown hurricane.
Because the atmosphere is largely transparent to microwaves, SeaWinds is able to cover 93 percent of the global oceans, under both clear and cloudy conditions, in a single day, with the capability of a synoptic view of the ocean. The high resolution of the data also gives detailed description of small and intense weather systems, like Hurricane Floyd. The image in the insert is based on data specially produced at 12.5 kilometers (7.7 miles). In the insert, white arrows of wind vector are imposed on the color image of wind speed. The insert represents a 3-degree area occupied by Hurricane Floyd. After these data were acquired, Hurricane Floyd turned north. Its strength and proximity to the Atlantic coast of the U.S. caused the largest evacuation of citizens in U.S. history. Its landfall on September 16, 1999 resulted in severe flooding and devastation in the Carolinas. The high-resolution SeaWinds data provided an opportunity to monitor and study this hurricane.
NASA's Earth Science Enterprise is a long-term research and technology program designed to examine Earth's land, oceans, atmosphere, ice and life as a total integrated system. JPL is a division of the California Institute of Technology, Pasadena, CA.