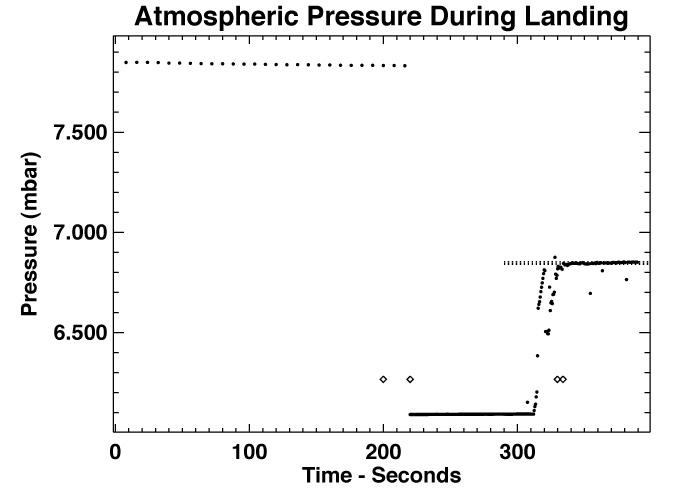
This figure shows the variation with time of pressure (dots) measured by the Pathfinder MET instrument during the landing period shown in image PIA00797. The two diamonds indicate the times of bridal cutting and 1st impact. The overall trend in the data is of pressure increasing with time. This is almost certainly due to the lander rolling downhill by roughly 10 m. The spacing of the horizontal dotted lines indicates the pressure change expected from 10 m changes in altitude. Bounces may also be visible in the data.
Photojournal note: Sojourner spent 83 days of a planned seven-day mission exploring the Martian terrain, acquiring images, and taking chemical, atmospheric and other measurements. The final data transmission received from Pathfinder was at 10:23 UTC on September 27, 1997. Although mission managers tried to restore full communications during the following five months, the successful mission was terminated on March 10, 1998.
