El Niño 2009-2010 just keeps hanging in there. Recent sea-level height data from the NASA/European Ocean Surface Topography Mission/Jason-2 oceanography satellite show that a large-scale, sustained weakening of trade winds in the western and central equatorial Pacific during late-January through February has triggered yet another strong, eastward-moving wave of warm water, known as a Kelvin wave. Now in the central and eastern equatorial Pacific, this warm wave appears as the large area of higher-than-normal sea surface heights (warmer-than-normal sea surface temperatures) between 150 degrees west and 100 degrees west longitude. A series of similar, weaker events that began in June 2009 initially triggered and has sustained the present El Niño condition.
JPL oceanographer Bill Patzert says it's too soon to know for sure, but he would not be surprised if this latest and largest Kelvin wave is the 'last hurrah' for this long-lasting El Niño. "Since June 2009, this El Niño has waxed and waned, impacting many global weather events. I and many scientists expect the current El Niño to leave the stage sometime soon. What comes next is not yet clear, but a return to El Niño's dry sibling, La Niña, is certainly a possibility, though by no means a certainty. We'll be monitoring conditions closely over the coming weeks and months," said Patzert.
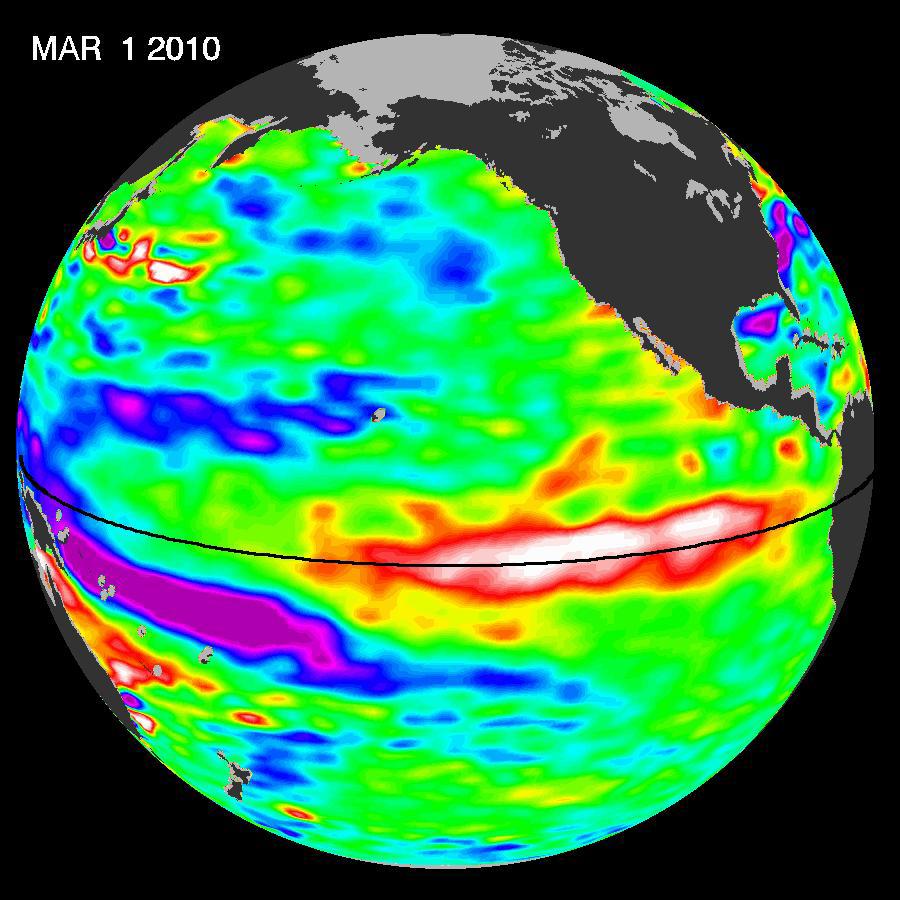
This image was created with data collected by the U.S./European satellite during a 10-day period centered on March 1, 2010. It shows a red and white area in the central and eastern equatorial Pacific that is about 10 to 18 centimeters (4 to 7 inches) above normal. These regions contrast with the western equatorial Pacific, where lower-than-normal sea levels (blue and purple areas) are between 8 to 15 centimeters (3 and 6 inches) below normal. Along the equator, the red and white colors depict areas where sea surface temperatures are more than one to two degrees Celsius above normal (two to four degrees Fahrenheit).
For more information on NASA's ocean surface topography missions, see http://sealevel.jpl.nasa.gov/ or to view the latest Jason data see http://sealevel.jpl.nasa.gov/science/jason1-quick-look/.
 Planetary Data System


