Click on image for HD animation at 30 frames per second
Click here for animation at 2 frames per second
View the California CO Times Series on Google Earth™
(see instructions at the bottom of this caption)A large number of wildfires, many of them triggered by powerful lightning storms on June 21, erupted around California over the next several weeks. At their peak, more than 2,000 fires were active, from northern California down to Santa Barbara County. Cumulatively the fires have burned nearly 1,480 square miles (more than 978,000 acres) and destroyed well over 100 homes in what officials have called the largest fire event in California history.
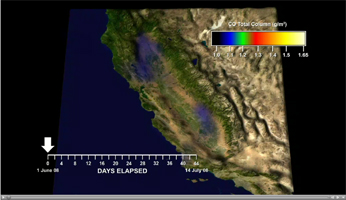
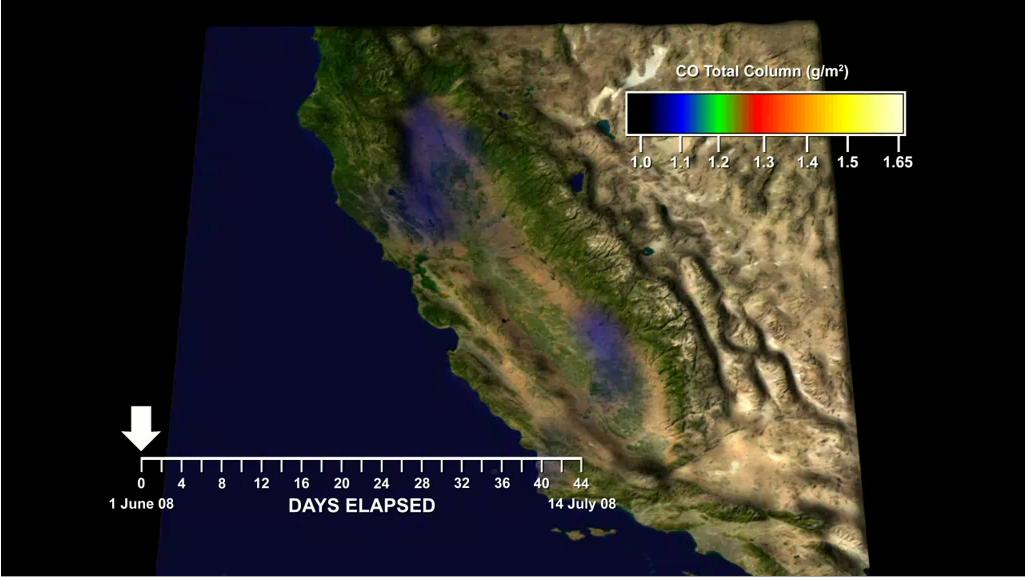
In this animation created with data retrieved by NASA's spaceborne instrument called the Atmospheric Infrared Sounder, or AIRS, on NASA's Aqua spacecraft, we visualize the rapid increases in carbon monoxide (CO) emitted by fires burning in California in June and July 2008. Only the largest values of CO detected by AIRS are shown to highlight the impact of the fires. AIRS primarily observes CO in a layer from 2 to 7 kilometers above Earth's surface. Thus, it tends to see where the wind blows the carbon monoxide and not just the smoke directly above the fires. However, many of these intense fires lofted a significant amount of carbon monoxide directly above the fires, making the hotspots also visible to AIRS.
For example, CO appears over a fire in Butte County on June 11-14, and over the Piute Fire in Kern County on June 23. The most intense CO plumes emanated from the fires in Northern California started by dry lightning on June 20 and 21. The activity of these fires flared again from July 8-10. AIRS can even see the large amount of CO from this smoke filling California's Central Valley during both of these episodes and lingering as seen on July 12.
Although the CO amounts seen by AIRS are not directly harmful, CO along with other chemicals in wildfire smoke can lead to the production of dangerous levels of ozone pollution. Smoke from these fires contributed to severe ozone and particulate pollution in portions of California's Central Valleys during June 22-29 and July 7-10.
View the California CO Time Series on Google Earth™
Download the file below:
California_CO_Time-Series.kmz
Note: If you have not already done so, you will need to download Google Earth™; click on the link for "Other Information" in the legend to the right of the image at the top of this page.
Once the file is on your computer, launch the California_CO_Time-Series.kmz file by double-clicking on it. Inside the display area of Google Earth™ you will see a time slider at the top right (clock icon). Click on the clock icon and select "UTC (Coordinated Universal Time)" from the "Display Time In" dialog box; you can also control the speed of the animation by adjusting the speed bar in the same dialog box; set the animation speed about a quarter to the left. On the left of the Google Earth™ screen you will see a window displaying a folder called "Temporary Places"; inside this folder is a folder called "California CO Times Series." Click on the play triangle to the right of the time slider to start the image. It will take several minutes for all the files to load. Once all the files have been loaded, the time series will begin to display.
About AIRS
The Atmospheric Infrared Sounder, AIRS, in conjunction with the Advanced Microwave Sounding Unit, AMSU, senses emitted infrared and microwave radiation from Earth to provide a three-dimensional look at Earth's weather and climate. Working in tandem, the two instruments make simultaneous observations all the way down to Earth's surface, even in the presence of heavy clouds. With more than 2,000 channels sensing different regions of the atmosphere, the system creates a global, three-dimensional map of atmospheric temperature and humidity, cloud amounts and heights, greenhouse gas concentrations, and many other atmospheric phenomena. Launched into Earth orbit in 2002, the AIRS and AMSU instruments fly onboard NASA's Aqua spacecraft and are managed by NASA's Jet Propulsion Laboratory in Pasadena, Calif., under contract to NASA. JPL is a division of the California Institute of Technology in Pasadena.
More information about AIRS can be found at http://airs.jpl.nasa.gov.